Manufacturing Management System F.P.I.sys
Integrated Manufacturing Management System for Parts Processing Industry with High-mix, Low-volume Production
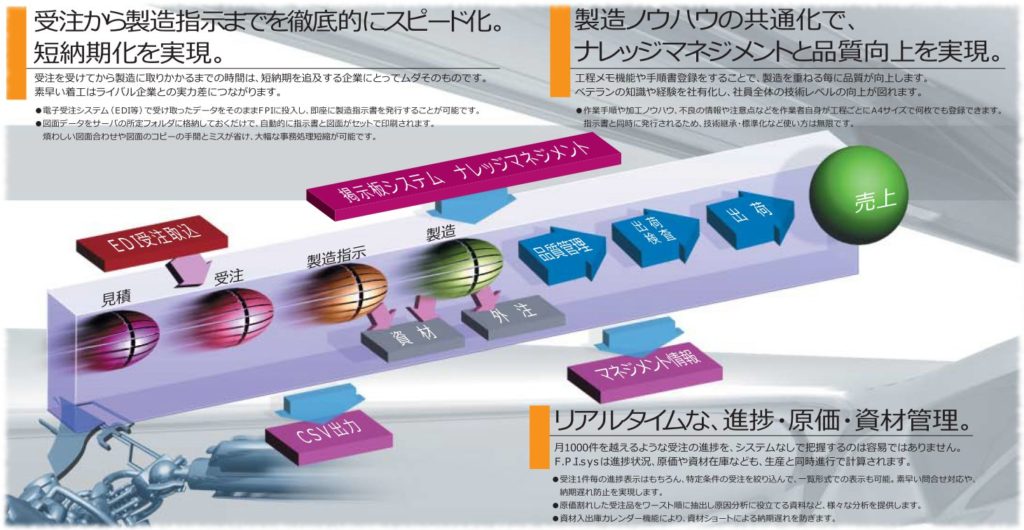
F.P.I.sys is a manufacturing management system that has been developed by Umeda Kogyo since 1995 while being implemented at manufacturing sites. We have acquired a variety of expertise knowledge from the manufacturing site and have created a system with the functionality and usability required at the actual manufacturing site. It is a production control system made by factories for factories. Even today, in an era of shorter delivery times and smaller lot sizes, we continue to adapt our system flexibly to meet the needs of the times and promptly respond to the potential demands of the times and of our customers. At Umeda Kogyo, all manufacturing-related work within the company is centred around this system, which not only increases speed and efficiency, but also allows us to share technology within the company, contributing to the improvement of quality and technology levels.
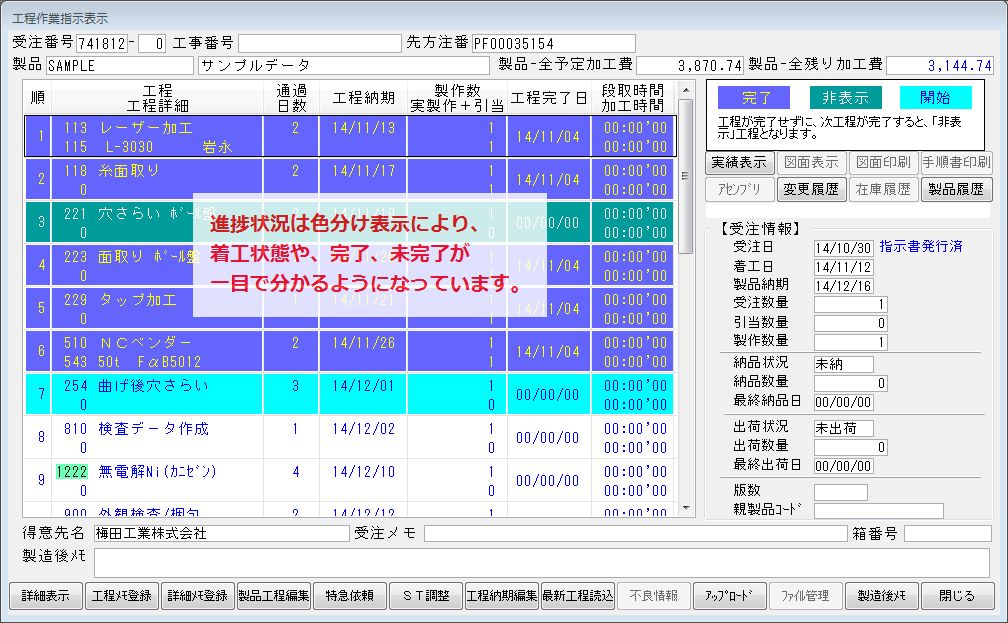
Real-time progress
- By inputting actual manufacturing results, completed processes are displayed in blue and shown in real time, allowing for prompt responses to inquiries as well as eliminating the time and effort required to locate products.
- Inventory drawdown and cost calculation are automatically performed at the same time as progress updates.
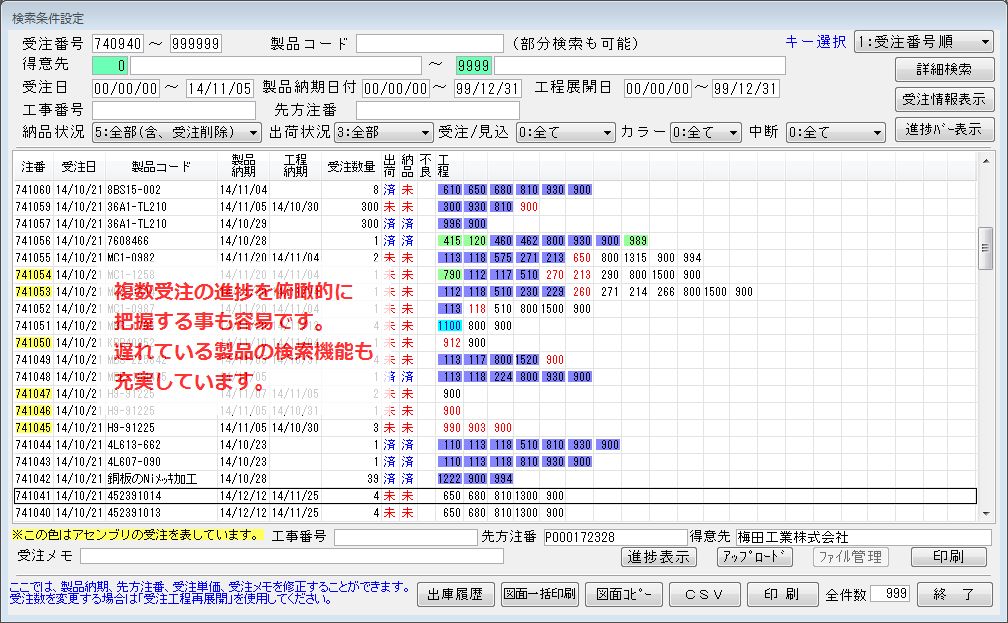
Listing of Progress Status by Narrowing Down the Results According to Specific Criteria
- The status of multiple orders is displayed at once.
- Orders can be narrowed down to specific customers, delivery dates, etc. to confirm immediately whether there are any delays or abnormalities.
Predictive Loading Status
Real-time sharing of loading data in conjunction with orders and actual results
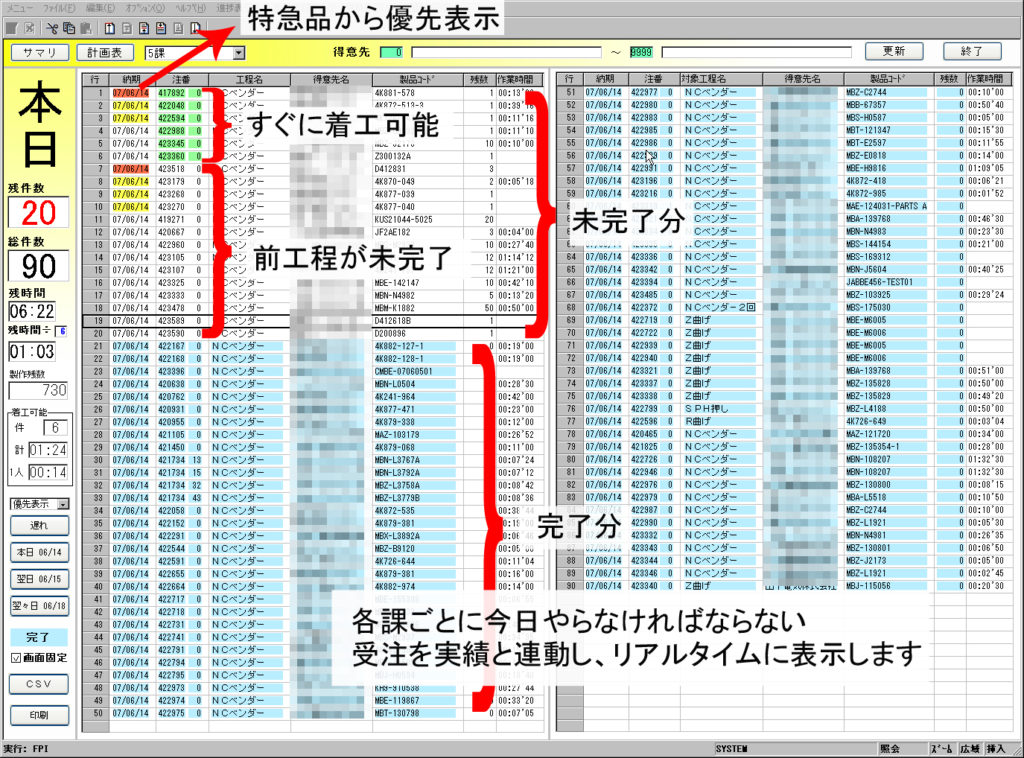
Process control board displays loading information for each section
- Shows a list of today’s operations in real time for each section.
- As actual work is being input, it is highlighted in blue, allowing the user to predictively verify the remaining workload.
- The previous process is shown as completed, so the user can confirm that the next process is ready to be performed.
- The list is sorted from top to bottom in the order of urgency, enabling workers to prioritize their work.
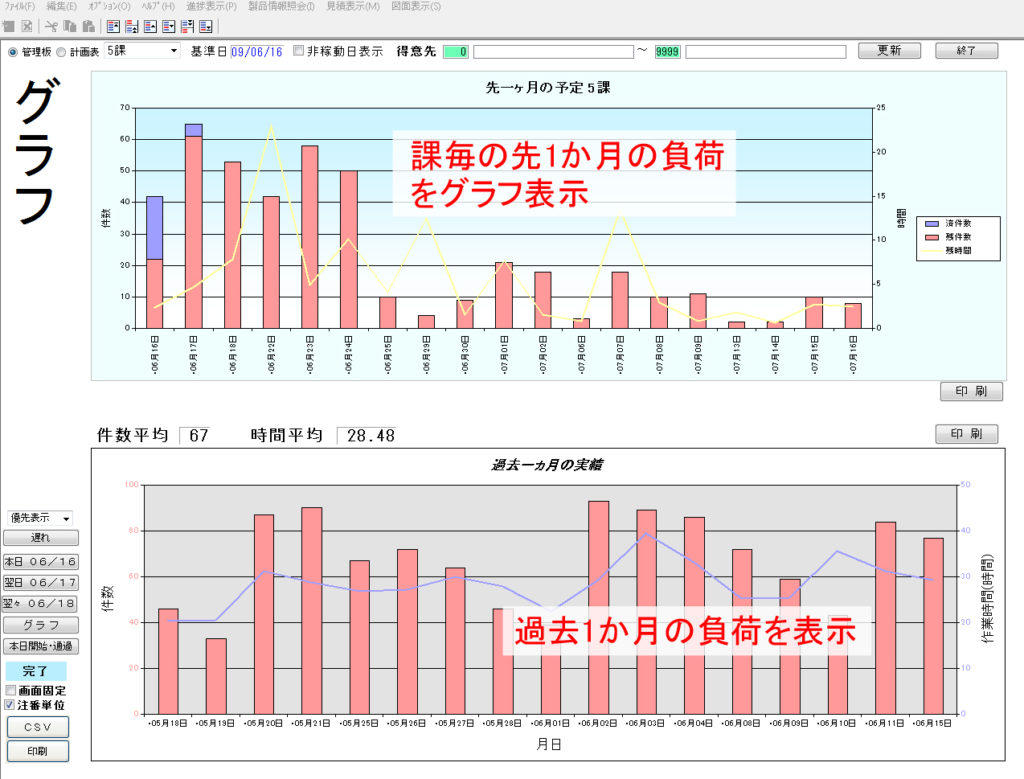
Loading Information of the Last 1 Month
- Graphically displays last month’s load by each section
- Intuitive confirmation of load for the next month.
- Real-time display onsite allows for site-driven load shedding.
Technical Transfer through Know-How Sharing
From individual know-how to organizational know-how
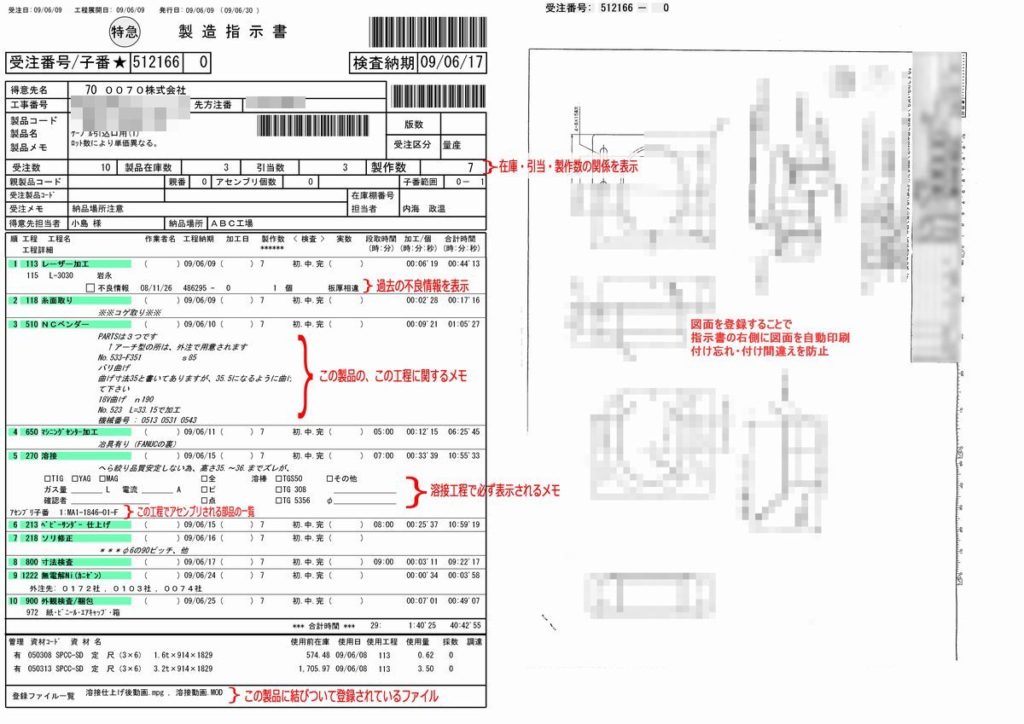
Manufacturing Manuals Growing Along with the Workplace
- When an order is registered, a manufacturing manual named “Manufacturing Manual,” is printed.
- The manual provides necessary on-site information such as delivery schedules for each process and information on the materials to be used.
- When drawings are recorded, they are automatically printed on the instruction sheet.
- Technical information and precautions can be recorded for each process and will be printed on the instruction sheet from the next order.
- Repeated manufacturing builds up manufacturing knowledge, which is useful in improving technology and quality.
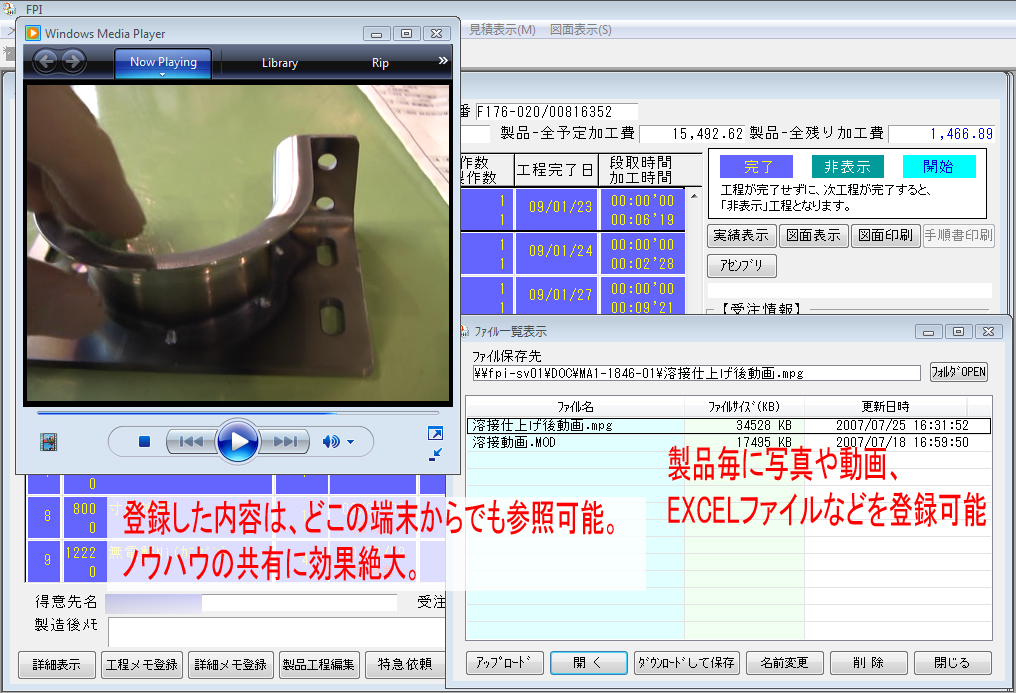
Storage of Various Files
- You can file photos, videos, EXCEL files, etc. for each product.
- The contents of the stored files can be accessed from any points.
- By saving operation videos, images of finished products, procedure manuals, etc., users can improve quality and share their knowledge.
DONBURIKUN PRO: Easy Quotation for the Manufacturing Industry
Easy operation allows for revision, validation, and assurance of the quotation results.
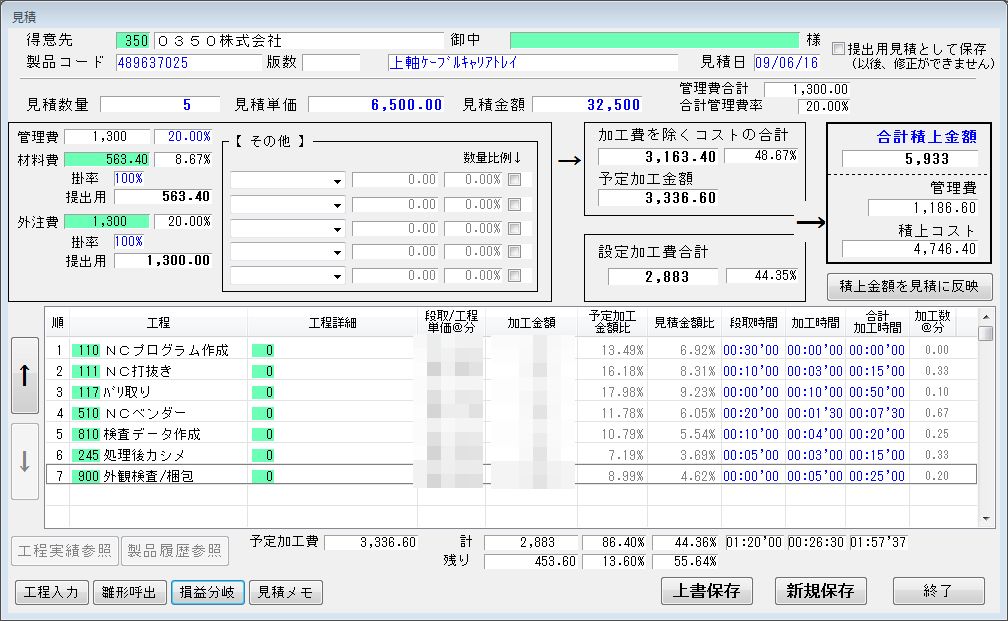
Quotation Screen
- This screen supports both “accumulation-type quotation” in which manufacturing costs are to be added and “allocation-type quotation” in which costs are allocated based on a target amount.
- Direct input of production time, percentage of unit cost, and number of processes per minute are available.
- The settings such as amount, time, ratio, and quantity are automatically always calculated against each other, so revisions and verifications can be easily reiterated until the user is satisfied with the results.
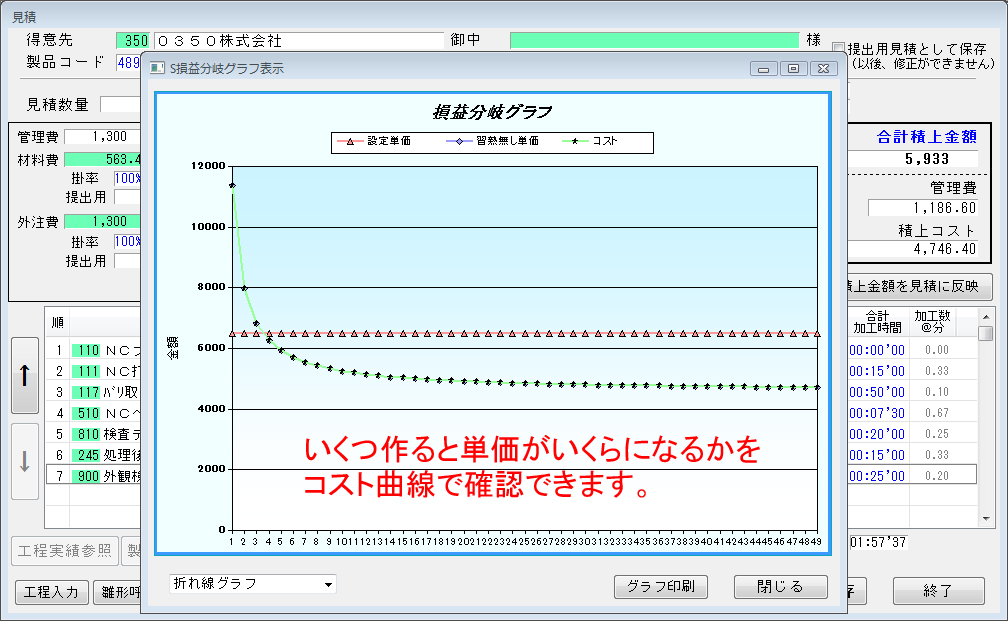
Profit and Loss Break-even Graph
- Whenever the quantity quoted is amended, the amount is recalculated and adjusted automatically.
- The break-even graph indicates the amount of the quoted quantity.
- By entering a target amount in the estimated unit price, the user can determine the amount by which the quoted quantity will be within the target unit price.
- If you use the break-even graph, you can see how much the estimated quantity will be at what time.
- If you enter the target amount in the estimated unit price, you can see how many more you need to estimate to get within the target unit price.
Target Companies
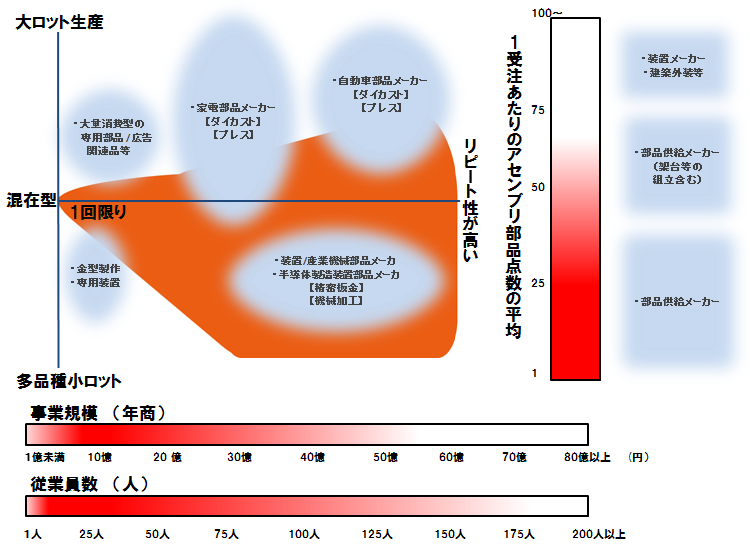
Small and medium-sized companies with a wide variety of products in small lots
